
PUBLISHED January 21, 2026
According to “Economie groeit met 0,5 procent in derde kwartaal 2025” from CBS.nl, over the third quarter of 2025, the Netherlands achieved stronger economic growth than first reported. New data from the national statistics agency revealed an upward revision in economic output. Gross domestic product (GDP) grew by 0.5% compared with the previous quarter. This figure was 0.1 percentage point higher than the first estimate published earlier. The revision reflects improved data mainly on export activity. Exports and government spending were key contributors to the increase. Household consumption also played a supporting role in the growth picture.
This revised GDP figure is part of the second estimate released about three months after the quarter ended. The first estimate is based on early data available roughly one month after the quarter concludes. As more detailed information arrives from businesses and sectors across the economy, figures are updated. Such revisions are standard and reflect better data coverage. Historically, second estimates of quarterly growth differ only slightly from first estimates. Over the past five years, these revisions averaged about 0.1 percentage point. This indicates relative stability in the measurement of economic performance.
The Dutch statistical office recalculated the third quarter GDP after receiving more complete data from companies and institutions spanning manufacturing, services, and trade. The revised expansion rate of 0.5% reflects stronger activity than the initial figure of 0.4%. This adjustment was primarily due to higher reported export volumes, which contributed significantly to economic output. Public consumption, including government spending on services and infrastructure, also supported the expansion. Household consumption — spending by Dutch households on goods and services — remained a steady contributor to growth. Elsewhere in the economy, investment trends varied across sectors, but overall activity remained positive. Such revisions underscore how dynamic economic measurement can be as new data arrives.
The Dutch statistical office recalculated the third quarter GDP after receiving more complete data from companies and institutions spanning manufacturing, services, and trade. The revised expansion rate of 0.5% reflects stronger activity than the initial figure of 0.4%. This adjustment was primarily due to higher reported export volumes, which contributed significantly to economic output. Public consumption, including government spending on services and infrastructure, also supported the expansion. Household consumption — spending by Dutch households on goods and services — remained a steady contributor to growth. Elsewhere in the economy, investment trends varied across sectors, but overall activity remained positive. Such revisions underscore how dynamic economic measurement can be as new data arrives.
Exports of goods and services formed the backbone of quarterly growth in the third quarter of 2025. As trade volumes increased, the Netherlands benefited from stronger international demand, particularly from other European economies and overseas markets. Industrial production and logistics-related services were among the sectors that gained most from this rise in export activity. Public consumption — government purchases of services and goods — also rose during the quarter. Spending increased in areas such as healthcare, public administration, and infrastructure maintenance, providing additional support to domestic demand. Together, exports and government expenditure accounted for the largest share of the GDP increase. Household consumption added further momentum to the economy. Families continued to spend on everyday necessities such as food, housing, energy, and transportation, despite ongoing cost pressures in some sectors. Consumer confidence remained relatively stable, helping to sustain retail and service-sector activity. This combination of foreign demand and internal spending suggests that growth was not dependent on a single factor. Instead, it reflected a balanced contribution from both international trade and domestic economic activity. Such diversity in growth drivers generally strengthens economic resilience against external shocks.
While quarterly changes in employment levels were modest, the broader annual trend remained positive. Compared with the third quarter of 2024, the number of people in work increased across most sectors of the economy. Both salaried employees and self-employed workers contributed to this upward movement. The revised figures indicate that earlier employment estimates slightly underestimated job growth. Service industries, including healthcare, education, and business services, accounted for a significant share of new positions. Construction and technical professions also showed gradual improvement after a slower start to the year. On a year-on-year basis, total economic output expanded by 1.8 percent, exceeding the preliminary estimate. This stronger annual performance reflects sustained demand for Dutch products abroad and steady spending at home. It also suggests that businesses maintained investment and hiring plans despite global economic uncertainty. Rising employment tends to reinforce consumer confidence and purchasing power, which in turn supports household spending. This feedback loop between job growth and consumption helped stabilize economic conditions throughout 2025. Taken together, the labor market data and annual GDP growth point to a structurally healthier economy than earlier expected.
Source: Statistics Netherlands (CBS), 2025.
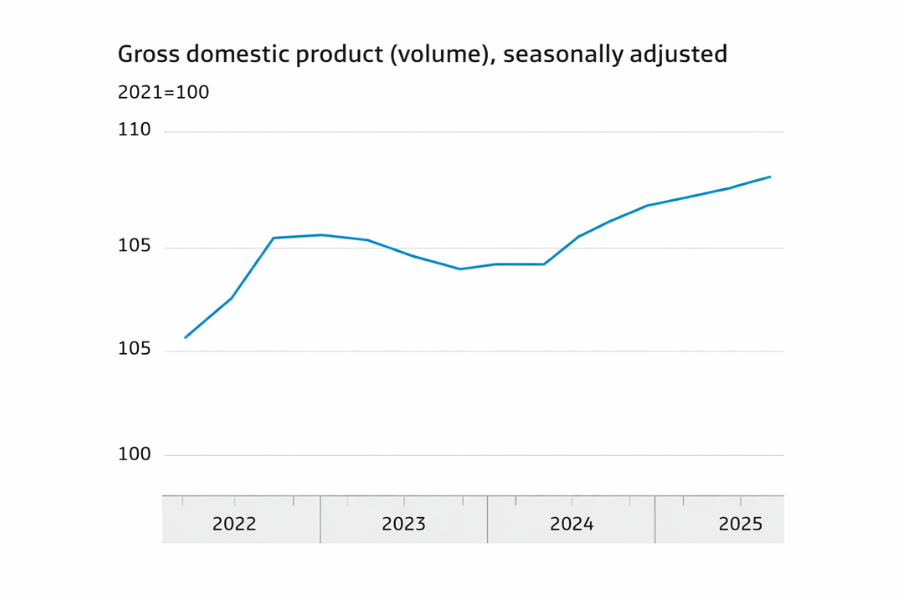
The graph in the CBS report shows the seasonally adjusted GDP index (base 2021 = 100) for the Netherlands over several quarters, highlighting economic fluctuations around the pandemic and into 2025. The data indicate that after a notable dip in late 2022 and early 2023, the economy regained momentum, climbing steadily through 2024 and into 2025. By the third quarter of 2025 the GDP index reached approximately 107.7, higher than previous quarters and above levels seen in much of 2023 and early 2024. This climb reflects a moderate but consistent recovery trend following earlier contraction and slower growth phases in the post-pandemic period. The pattern suggests that while growth was not rapid, it was stable, with few sharp downturns after 2022. Quarterly increases — such as from Q2 to Q3 2025 — are visible in the index rises, corresponding with the reported 0.5% growth. Overall, the chart supports the narrative of a resilient economy that has overcome short-term contractions and is trending upward, with gains driven by exports, government consumption, and solidified demand. This visual context enhances the written GDP figures and shows how economic output has evolved over time.
Exports of goods and services formed the backbone of quarterly growth in the third quarter of 2025. As trade volumes increased, the Netherlands benefited from stronger international demand, particularly from other European economies and overseas markets. Industrial production and logistics-related services were among the sectors that gained most from this rise in export activity. Public consumption — government purchases of services and goods — also rose during the quarter. Spending increased in areas such as healthcare, public administration, and infrastructure maintenance, providing additional support to domestic demand. Together, exports and government expenditure accounted for the largest share of the GDP increase. Household consumption added further momentum to the economy. Families continued to spend on everyday necessities such as food, housing, energy, and transportation, despite ongoing cost pressures in some sectors. Consumer confidence remained relatively stable, helping to sustain retail and service-sector activity. This combination of foreign demand and internal spending suggests that growth was not dependent on a single factor. Instead, it reflected a balanced contribution from both international trade and domestic economic activity. Such diversity in growth drivers generally strengthens economic resilience against external shocks.
While quarterly changes in employment levels were modest, the broader annual trend remained positive. Compared with the third quarter of 2024, the number of people in work increased across most sectors of the economy. Both salaried employees and self-employed workers contributed to this upward movement. The revised figures indicate that earlier employment estimates slightly underestimated job growth. Service industries, including healthcare, education, and business services, accounted for a significant share of new positions. Construction and technical professions also showed gradual improvement after a slower start to the year. On a year-on-year basis, total economic output expanded by 1.8 percent, exceeding the preliminary estimate. This stronger annual performance reflects sustained demand for Dutch products abroad and steady spending at home. It also suggests that businesses maintained investment and hiring plans despite global economic uncertainty. Rising employment tends to reinforce consumer confidence and purchasing power, which in turn supports household spending. This feedback loop between job growth and consumption helped stabilize economic conditions throughout 2025. Taken together, the labor market data and annual GDP growth point to a structurally healthier economy than earlier expected.
Source: Statistics Netherlands (CBS), 2025.
The graph in the CBS report shows the seasonally adjusted GDP index (base 2021 = 100) for the Netherlands over several quarters, highlighting economic fluctuations around the pandemic and into 2025. The data indicate that after a notable dip in late 2022 and early 2023, the economy regained momentum, climbing steadily through 2024 and into 2025. By the third quarter of 2025 the GDP index reached approximately 107.7, higher than previous quarters and above levels seen in much of 2023 and early 2024. This climb reflects a moderate but consistent recovery trend following earlier contraction and slower growth phases in the post-pandemic period. The pattern suggests that while growth was not rapid, it was stable, with few sharp downturns after 2022. Quarterly increases — such as from Q2 to Q3 2025 — are visible in the index rises, corresponding with the reported 0.5% growth. Overall, the chart supports the narrative of a resilient economy that has overcome short-term contractions and is trending upward, with gains driven by exports, government consumption, and solidified demand. This visual context enhances the written GDP figures and shows how economic output has evolved over time.

Reform PRODUCTS & SERVICES Group
Szentendrei út 87.
1033 Budapest
Hungary